PhysioLab is a multivariate signal toolbox created in Matlab to simplify physiological signal processing, especially for out-of-the-lab fitness experiments. The toolbox is intended to assist both researchers and non-experts in the arduous task of processing physiological signals, allowing cross-comparisons between each signal, an automatic feature extraction with manual adjustments and providing a novel visualization for CRF assessment. The toolbox graphically shows the effects of multiple signal processing methods, which facilitates the understanding and prevent common mistakes such as include motion artifacts.
Physiological Signals
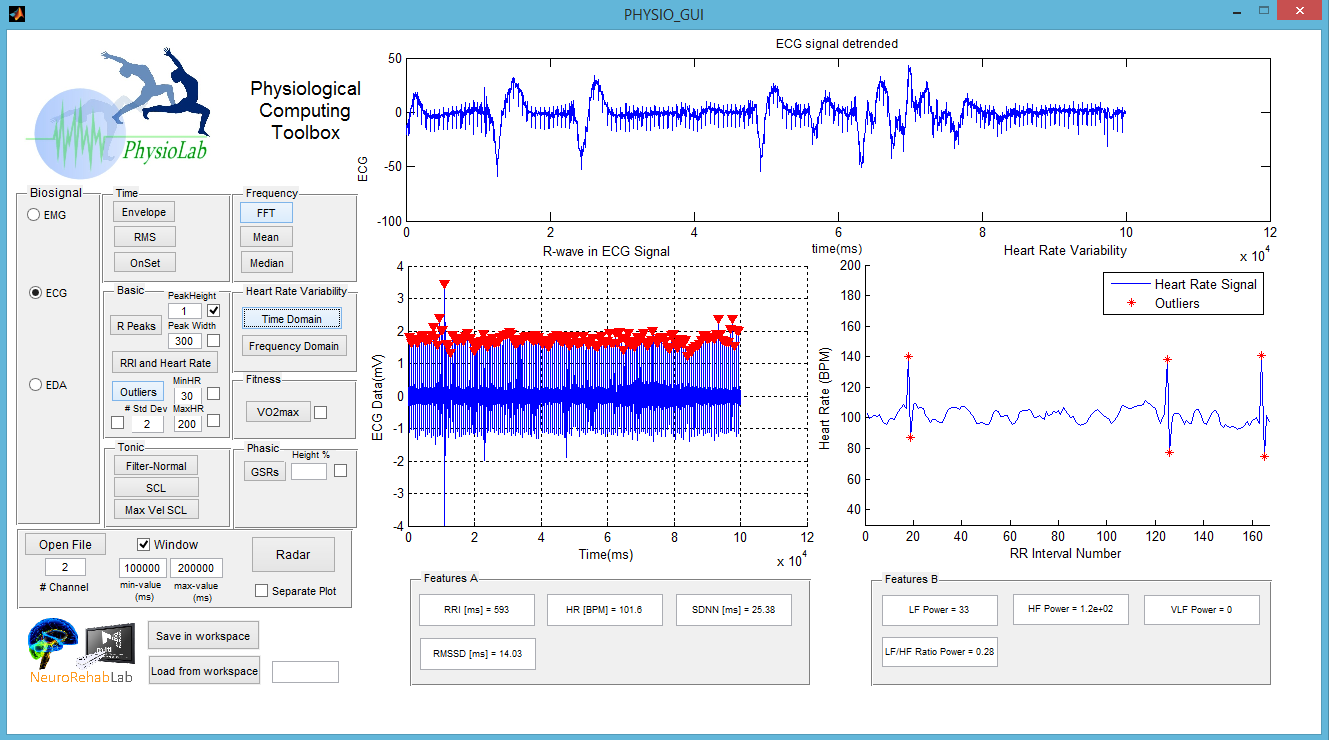
The software provides a wide variety of signal processing methods and artifact removal filters for:
- Electromyography (EMG): Envelope, RMS, OnSet, FFT, MeanFrequency, MedianFrequency.
- Electrocardiography (ECG): R-Peak, RRI, HR, HRV, SDNN, RMSD, LF, HF, VLF, LH/HF.
- Electrodermal Activity (EDA): SCL, MaxVel SCL, GSRs.
Final parameters and processed signals can be exported easily by PhysioLab which supports data from multiple low-cost physiological sensors and allows performing data pre-processing and feature extraction. Multiple features from each signal are extracted to provide the most widely used and documented parameters.
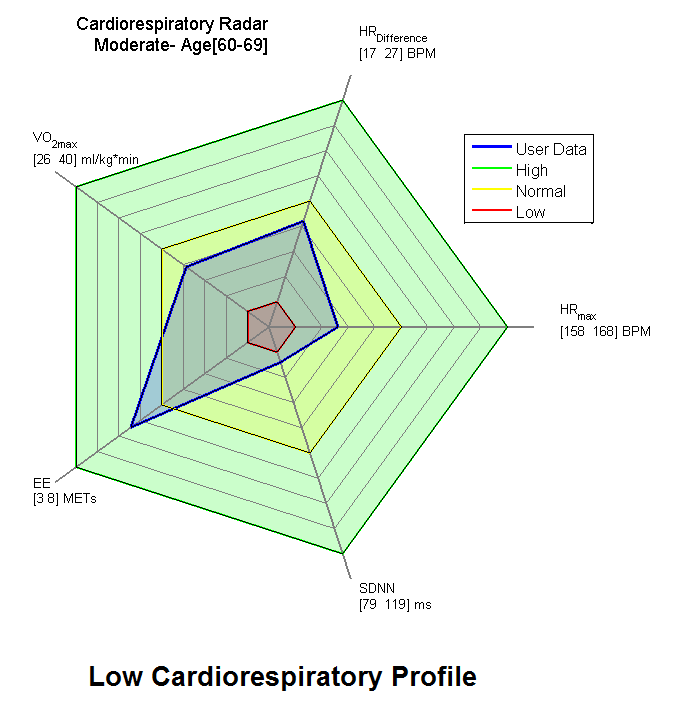
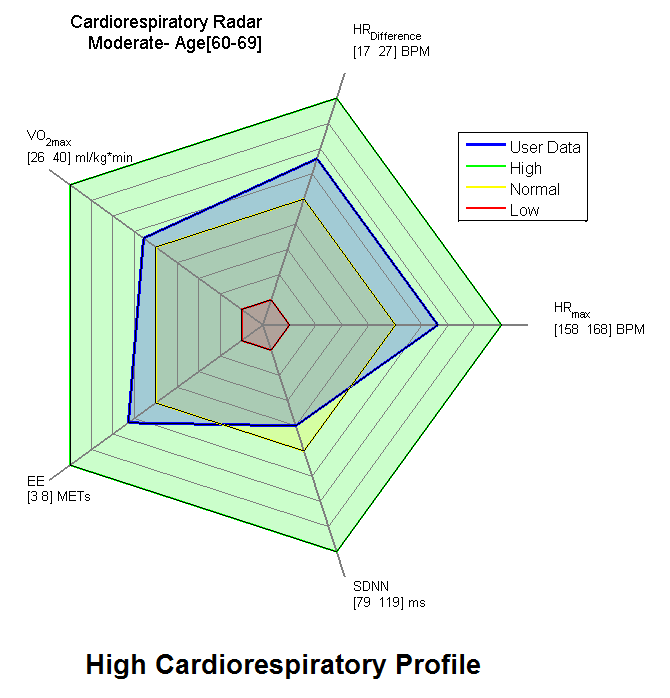
Visualization using radar plots
Additionally, PhysioLab contains a novel tool to visualize multiple physiological parameters in specialized fitness domains using radar plots, providing contextual normative data and facilitating data interpretation.
Developed by: John Muñoz
If you want to know more about the visualization, please check:
Muñoz, J., Bermúdez i Badia, S., Cameirão, M., & Gouveia, ER. (2015). Visualization of Multivariate Physiological Data for Cardiorespiratory Fitness Assessment through ECG (R-Peak) Analysis. 37th Annual International Conference of the IEEE Engineering in Medicine and Biology Society. CITE DOWNLOAD
Here you can dowload our most recent version of PhysioLab.
Requirements to use the package
Download Links
Latest Stable Version:
- PhysioLab 2017.05 (May 2017) (Inclusion of a sub-menu for Radar Plotting, Improvement of misaligned windows in the GUI)